2. 辽宁工程技术大学 基础教学部, 葫芦岛 125105
2. Department of Basic Teaching, Liaoning Technical University, Huludao 125105, China
在许多现实生活应用中, 如人脸识别[1]、图像分类[2]、文字识别[3]、生物医学[4,5]等问题, 将观测对象表示为高维特征向量已成为一种必然趋势. 高维特征向量可以充分描述观测对象, 但也增加了数据可视化和可解释难度[6]. 在实际应用中, 并不是所有特征都是重要的和有鉴别性的, 高维特征向量中的大多数特征往往相互关联或冗余, 这些特征在聚类中会造成过拟合、处理效率低等问题. 为解决这些问题, 最近的研究关注于从原始特征中选择出具有大量有效信息的特征. 这种方法被称为特征选择[7].
相比于使用代数方法降低特征维度[8,9], 特征选择直接从给定的特征集合中选择具有强分类信息且尽可能相互独立的特征组成特征子集, 从而实现更快的降维, 消除冗余. 而且, 由于选择的特征与原始特征有明确的联系, 所以选择出的特征具有更好的解释性, 这有利于可视化和解释任务[10].
根据算法中标签存在情形, 特征选择可分为有监督[11]、半监督[12]、无监督[13–15]这3类. 前两类算法的执行结果受限于标签信息的使用情况. 在实际应用中, 大量易获取的高维数据通常是无标签的, 而为这些数据添加标签相当耗时且需要额外开销. 因此无监督特征选择方法更为流行和实用.
无监督特征选择方法主要分为3类: 过滤式、包裹式和嵌入式. 过滤式方法通过相关统计量来选择重要特征, 在模型训练过程中先进行特征选择再训练模型[16,17], 其特征选择和模型训练独立进行, 不能充分考虑特征之间的组合关系. 在包裹式方法中, 特征选择被“包裹”在学习方法中, 并以特征的分类性能作为评价标准[18], 但其计算开销较大, 不利于大规模数据集求解. 嵌入式方法在模型构建过程中同时进行特征选择[14], 在实践中具有较好的性能和相当低的计算复杂度.
为实现特征选择, 无监督特征选择通常需要解决两个问题. 首先, 无监督特征选择需要可靠的标签, 但无监督方法并没有真实标签作为参考. 最近的研究方法通常将标签来源与聚类算法[15]结合, 探索数据特征与伪标签信息的相关性来指导特征选择. 其次, 当数据维度过高时, 运用有效求解方法寻找最优组合选择出有效特征是十分困难的, 因为特征选择本质上属于组合优化问题, 是NP难题[10]. 在一些方法中, 无监督特征选择方法的目标函数是凸的, 以保证收敛到最优解.
研究表明高维数据并不是均匀线性分布[19], 其分布通常是稀疏的, 高维数据包含了大量局部信息. 谱图理论在获取数据局部信息方面展现出了良好性能[20], 因此, 越来越多嵌入式无监督特征选择方法引入谱聚类以获得更好的聚类效果[21,22]. Cai等[13]提出MCFS(multi-cluster feature selection)通过谱聚类学习数据局部信息, 然后对特征进行评分以选择有效特征. Li等[14]提出NDFS (nonnegative discriminative feature selection)引入谱聚类和非负约束, 结合正交约束, 得到更为离散的聚类信息.
在稀疏低秩子空间聚类问题中, 为提高模型性能、避免关联矩阵过于稀疏, 学者们提出了群组效应的概念[23,24], 即如果样本彼此接近, 则其表示系数也是接近的, 因此群组效应保证了同一子空间内的数据可以分组在一起. Lu等[23]提出LSR (least squares regression)考虑群组效应, 对关联矩阵应用
在方法学习过程中, 通过对相关系数矩阵施加稀疏性约束[13,14,26,27]、正交约束[26,28,29]或不相关约束[30]等方式可以更有效地选择特征. Nie等[26]提出SOGFS (structured optimal graph feature selection)通过对相关系数矩阵施加
缺乏对聚类指示矩阵的关注, 可能导致以下问题. 首先, 特征选择方法可能选择与聚类标签不相关但与其他特征高度相关的特征. 这可能导致模型出现过拟合或低解释能力的问题. 其次, 特征选择方法忽略了聚类指示矩阵中的潜在结构和关联性, 导致模型无法捕捉到指示向量之间的复杂关系. 这可能导致聚类结果的不准确和方法泛化能力的下降. 因此, 本文提出对聚类指示矩阵关注不足的解决方法, 即基于
给定数据矩阵
聚类指示矩阵
相关系数矩阵
相似度矩阵使用
| $ {s_{ij}} = {{\text{e}}^{ - \frac{{||{{\boldsymbol{x}}_{{i}}} - {{\boldsymbol{x}}_{{j}}}||}}{{4t}}}} $ | (1) |
其中,
在实践中, 有全连接法计算所有样本之间的相似度和
给定矩阵
| $ ||{\boldsymbol{H}}|{|_F} = \sqrt {\sum\limits_{i = 1}^m {\sum\limits_{j = 1}^n {h_{ij}^2} } } $ | (2) |
给定向量
| $ ||{{\boldsymbol{h}}_{{i}}}|{|_2} = \sqrt {\sum\limits_{j = 1}^n {h_{ij}^2} } $ | (3) |
在本文中, 大写字母表示矩阵, 小写字母表示标量、索引或向量.
1.1 谱聚类聚类指示矩阵需要充分反映出样本的判别信息. 根据谱图理论[32], 如果两个样本点在数据集的亲和度图中具有高度相关性, 则与它们对应的聚类标签也具有高度相关性. 具体来说, 数据点
| $ \left\{\begin{split} & \min \frac{1}{2}\sum\limits_{i, j = 1}^n {{s_{ij}}||{{\boldsymbol{g}}_{{i}}} - } {{\boldsymbol{g}}_{{j}}}||_F^2 \\ & {\text{s.t.}}\;\;\;{{\boldsymbol{G}}^{\mathrm{T}}}{\boldsymbol{G}} = {{\boldsymbol{I}}} \end{split} \right.$ | (4) |
式(4)使
| $ \left\{\begin{split} & \min {\mathrm{tr}}({{\boldsymbol{G}}^{\mathrm{T}}}{\boldsymbol{LsG}}) \\ & {\text{s.t.}}\;\;\;{{\boldsymbol{G}}^{\mathrm{T}}}{\boldsymbol{G}} = {{\boldsymbol{I}}} \end{split} \right.$ | (5) |
矩阵
为了使指示矩阵获得更多的数据信息, 对矩阵
相关系数矩阵
| $ \left\{\begin{split} & \min ||{{\boldsymbol{X}}^{\mathrm{T}}}{\boldsymbol{W}} - {\boldsymbol{G}}||_F^2 \\ & {\text{s}}{\text{.t}}{\text{.}}\;\;\;{\boldsymbol{W}}^{\mathrm{T}}{{\boldsymbol{W}}} = {{\boldsymbol{I}}} \end{split}\right. $ | (6) |
其中,
在之前的工作中, 主要考虑矩阵
基于群组效应的考虑, 本文对式(6)添加关于聚类指示矩阵的正则项, 并提出相应定理及证明:
| $ \left\{\begin{split} &\mathrm{min}\|{{\boldsymbol{X}}}^{\rm T}{\boldsymbol{W}}-{\boldsymbol{G}}\|_{F}^{2}+\beta \|{\boldsymbol{G}}\|_{F}^{2}\\ &\text{s}\text{.t}\text{.}\;\;{{\boldsymbol{W}}}^{\rm T}{{\boldsymbol{W}}}={{\boldsymbol{I}}} \end{split}\right. $ | (7) |
其中,
定理1. 给定数据集
证明: 令
| $ \min ||{{\boldsymbol{W}}^{\mathrm{T}}}{\boldsymbol{x}} - {\boldsymbol{g}}||_F^2 + \beta ||{\boldsymbol{g}}||_F^2 $ | (8) |
令
| $ \frac{{\partial L({\boldsymbol{g}})}}{{\partial {{\boldsymbol{g}}_{{k}}}}}{|_{{\boldsymbol{g}} = {{\boldsymbol{g}}^{*}}}} = 0 $ | (9) |
对
| $ \left(1+\beta \right){\boldsymbol{g}}-{\boldsymbol{W}}^{\rm T}x=0 $ | (10) |
对于不同的
| $ \left(1+\beta \right){{\boldsymbol{g}}}_{i}-{{\boldsymbol{W}}}^{\rm T}{x}_{i}=0$ | (11) |
| $ \left(1+\beta \right){{\boldsymbol{g}}}_{j}-{{\boldsymbol{W}}}^{\rm T}{x}_{j}=0 $ | (12) |
由式(11)和式(12)可以得到:
| $ {{\boldsymbol{g}}}_{i}-{{\boldsymbol{g}}}_{j}=\frac{1}{1+\beta }{{\boldsymbol{W}}}^{\rm T}({{\boldsymbol{x}}}_{i}-{{\boldsymbol{x}}}_{j})$ | (13) |
最终推导如下:
| $ ||{{\boldsymbol{g}}_{{i}}} - {{\boldsymbol{g}}_{{j}}}|{|_2} = a||{{\boldsymbol{x}}_{{i}}} - {{\boldsymbol{x}}_{{j}}}|{|_2} $ | (14) |
其中,
式(14)表明如果样本
此外, 在应对噪声时, 聚类指示矩阵上施加
本文提出基于
| $\left\{ \begin{array}{l}\mathrm{min}\|{{\boldsymbol{X}}}^{\rm T}{\boldsymbol{W}}-{\boldsymbol{G}}\|_{F}^{2}+\alpha {\mathrm{tr}}({{\boldsymbol{G}}}^{\rm T}{\boldsymbol{LsG}})+\beta \|{\boldsymbol{G}}\|_{F}^{2}\\ \text{s.t.}\;\;\;{\boldsymbol{W}}^{\rm T}{\boldsymbol{W}}={{\boldsymbol{I}}}, {{\boldsymbol{G}}}^{\rm T}{\boldsymbol{G}}={{\boldsymbol{I}}}\end{array} \right.$ | (15) |
其中
如图1所示, 图1(a)–图1(c)分别表示通过主成分分析方法[8]对Jaffe数据集的原始所有特征、SOGFS方法选择的有效特征和FSGS方法选择的有效特征分别降至2维时的图示. 两个方法选择的特征维度为140. 通过图示可以明显看到, FSGS方法将原始图像中的绝大部分簇类进行了组别的划分, 形成群组, 而SOGFS方法处理后的簇类则不具备群组效应.
2.2 模型求解在方法MCFS中, 聚类指示矩阵

|
图 1 SOGFS与FSGS聚类效果和原数据集对比 |
目标函数需要求解矩阵
首先固定矩阵
| $ {\cal F}({\boldsymbol{G}}, {\boldsymbol{W}})=\left|\right|{{\boldsymbol{X}}}^{\rm T}{\boldsymbol{W}}-{\boldsymbol{G}}|{|}_{F}^{2}+\frac{1}{2}\mu ||{\boldsymbol{W}}^{\rm T}{\boldsymbol{W}}-{{\boldsymbol{I}}}|{|}_{F}^{2}$ | (16) |
对
| $ \frac{\partial {\cal F}}{\partial {\boldsymbol{W}}}=2{\boldsymbol{XX}}^{\rm T}W-2{\boldsymbol{XG}}+2\mu ({\boldsymbol{W}}{\boldsymbol{W}}^{\rm T}-{{\boldsymbol{I}}})W=0 $ | (17) |
得到关于矩阵
| $ {\boldsymbol{W}} = {[{\boldsymbol{X}}{{\boldsymbol{X}}^{\mathrm{T}}} + \mu ({\boldsymbol{W}}{{\boldsymbol{W}}}^{\mathrm{T}} - {{\boldsymbol{I}}})]^{ - 1}}{\boldsymbol{XG}} $ | (18) |
通过分析可知式(18)的时间复杂度为
| $ \left\{\begin{gathered} \min {\mathrm{tr}}({{\boldsymbol{W}}^{\mathrm{T}}}{{\boldsymbol{A}}^{\mathrm{T}}}{\boldsymbol{W}} - 2{{\boldsymbol{W}}^{\mathrm{T}}}{\boldsymbol{B}}) \\ {\text{s.t.}}\;\;{{\boldsymbol{W}}^{\mathrm{T}}}{\boldsymbol{W}} = {{\boldsymbol{I}}} \\ \end{gathered} \right.$ | (19) |
其中,
算法1. GPI方法
输入: 矩阵
输出: 矩阵
1)初始化: 初始化矩阵
2)循环:
3) Step 1: 更新矩阵
4) Step 2: 使用压缩奇异值分解法求解矩阵
5) Step 3: 更新矩阵
6)收敛或达到最大迭代次数时结束循环.
然后固定矩阵
| $ \begin{split} {\cal L}({\boldsymbol{G}}, {\boldsymbol{W}})=&\left|\right|{{\boldsymbol{X}}}^{\rm T}{\boldsymbol{W}}-{\boldsymbol{G}}|{|}_{F}^{2}+\alpha {\mathrm{tr}}({{\boldsymbol{G}}}^{\rm T}{\boldsymbol{LsG}})\\ & +\beta \left|\right|{\boldsymbol{G}}|{|}_{F}^{2}+\frac{1}{2}\gamma ||{{\boldsymbol{G}}}^{\rm T}{\boldsymbol{G}}-{{\boldsymbol{I}}}|{|}_{F}^{2} \end{split} $ | (20) |
对
| $ \begin{split} \frac{\partial {\cal L}}{\partial {\boldsymbol{G}}}=&-2({{\boldsymbol{X}}}^{\rm T}{\boldsymbol{W}}-{\boldsymbol{G}})+2\alpha {\boldsymbol{LsG}}\\ & +2\beta {\boldsymbol{G}}+2\gamma ({\boldsymbol{GG}}^{\rm T}-{{\boldsymbol{I}}}){\boldsymbol{G}}=0\end{split} $ | (21) |
得到关于矩阵
| $ {\boldsymbol{G}} = {[(1 + \beta - \gamma ){{\boldsymbol{I}}} + \alpha {\boldsymbol{Ls}} + \gamma {\boldsymbol{G}}{{\boldsymbol{G}}^{\mathrm{T}}}]^{ - 1}}{{\boldsymbol{X}}^{\mathrm{T}}}{\boldsymbol{W}} $ | (22) |
基于以上分析, FSGS步骤如算法2所示.
算法2. FSGS
输入: 数据矩阵
输出: 将所有
1)初始化: 初始化矩阵
2)计算相似度矩阵
3)循环:
4) Step 1: 更新矩阵
5) Step 2: 更新矩阵
6) Step 3: 更新迭代次数
7)收敛或达到最大迭代次数时结束循环.
2.3 复杂度分析根据算法2的步骤, 分析每步的时间复杂度.
Step 1中矩阵
Step 2中
综上所述, 算法2第
实验条件为Windows 10系统, 12 GB内存, Intel(R)Core(TM) i5-7200U @ 2.50 GHz, Python 3.8.
3.1 数据集和对照方法本文实验在9个真实数据集上进行, 包括人脸数据集(Jaffe[34], Msra25[35], Yale[13], ORL[13])、物品数据集COIL-20[36]、生物数据集(Lung[37], Glioma[38])、字符数据集(binary alphabet (BA)[39], USPS[40]). 表1展示了这些数据集的详细信息.
为了验证本文方法的精度, 对比如下无监督特征选择方法.
1) Baseline: 作为测试结果的基准线, 不进行特征选择, 采用K-means方法对所有样本特征进行聚类.
2) SMR (smooth representation clustering)[24]: 具有群组效应的子空间聚类算法, 通过应用图拉普拉斯正则化约束学习自表示矩阵, 不进行特征选择.
3) LS[16]: 通过保留局部流行结构的能力去给每个特征进行评分, 选择分数最高的前
| 表 1 数据集信息 |
4) MCFS[13]: 采用两步走策略, 首先通过归一化割方法获得聚类指示矩阵
5) NDFS[14]: 采用联合学习框架, 通过对矩阵
6) SOGFS[26]: 同时进行特征选择和局部结构学习, 可以自适应学习相似度矩阵. 通过对矩阵
7) FSDSC[28]: 通过正交回归模型学习矩阵
在应用特征选择方法产生特征标签后, 再使用K-means聚类算法对选择的特征进行聚类. 由于K-means算法的聚类结果与初始化有关, 所以对每个方法采用相同的随机种子进行20次K-means聚类, 然后记录平均结果用于分析.
在所选特征聚类形成簇类标签之后, 将簇类标签使用Kuhn-Munkres算法[41]与真实标签进行最佳匹配. 对匹配后的标签使用准确率(accuracy, ACC)和归一化互信息(normalized mutual information, NMI)进行评估. 在这两个指标中, 值越高方法越优.
3.3 参数设置特征选择算法在执行时需要提供选择的特征数量, Jaffe、Msra25、BA和USPS选择50–200个特征, 间隔30; 其他数据集选择50–300个特征, 间隔50. 对于需要调节参数的模型, 参数取值范围设置为{10−3, 10−2, 10−1, 1, 10, 102, 103}, 其中UDFS和FSGS调节的参数为
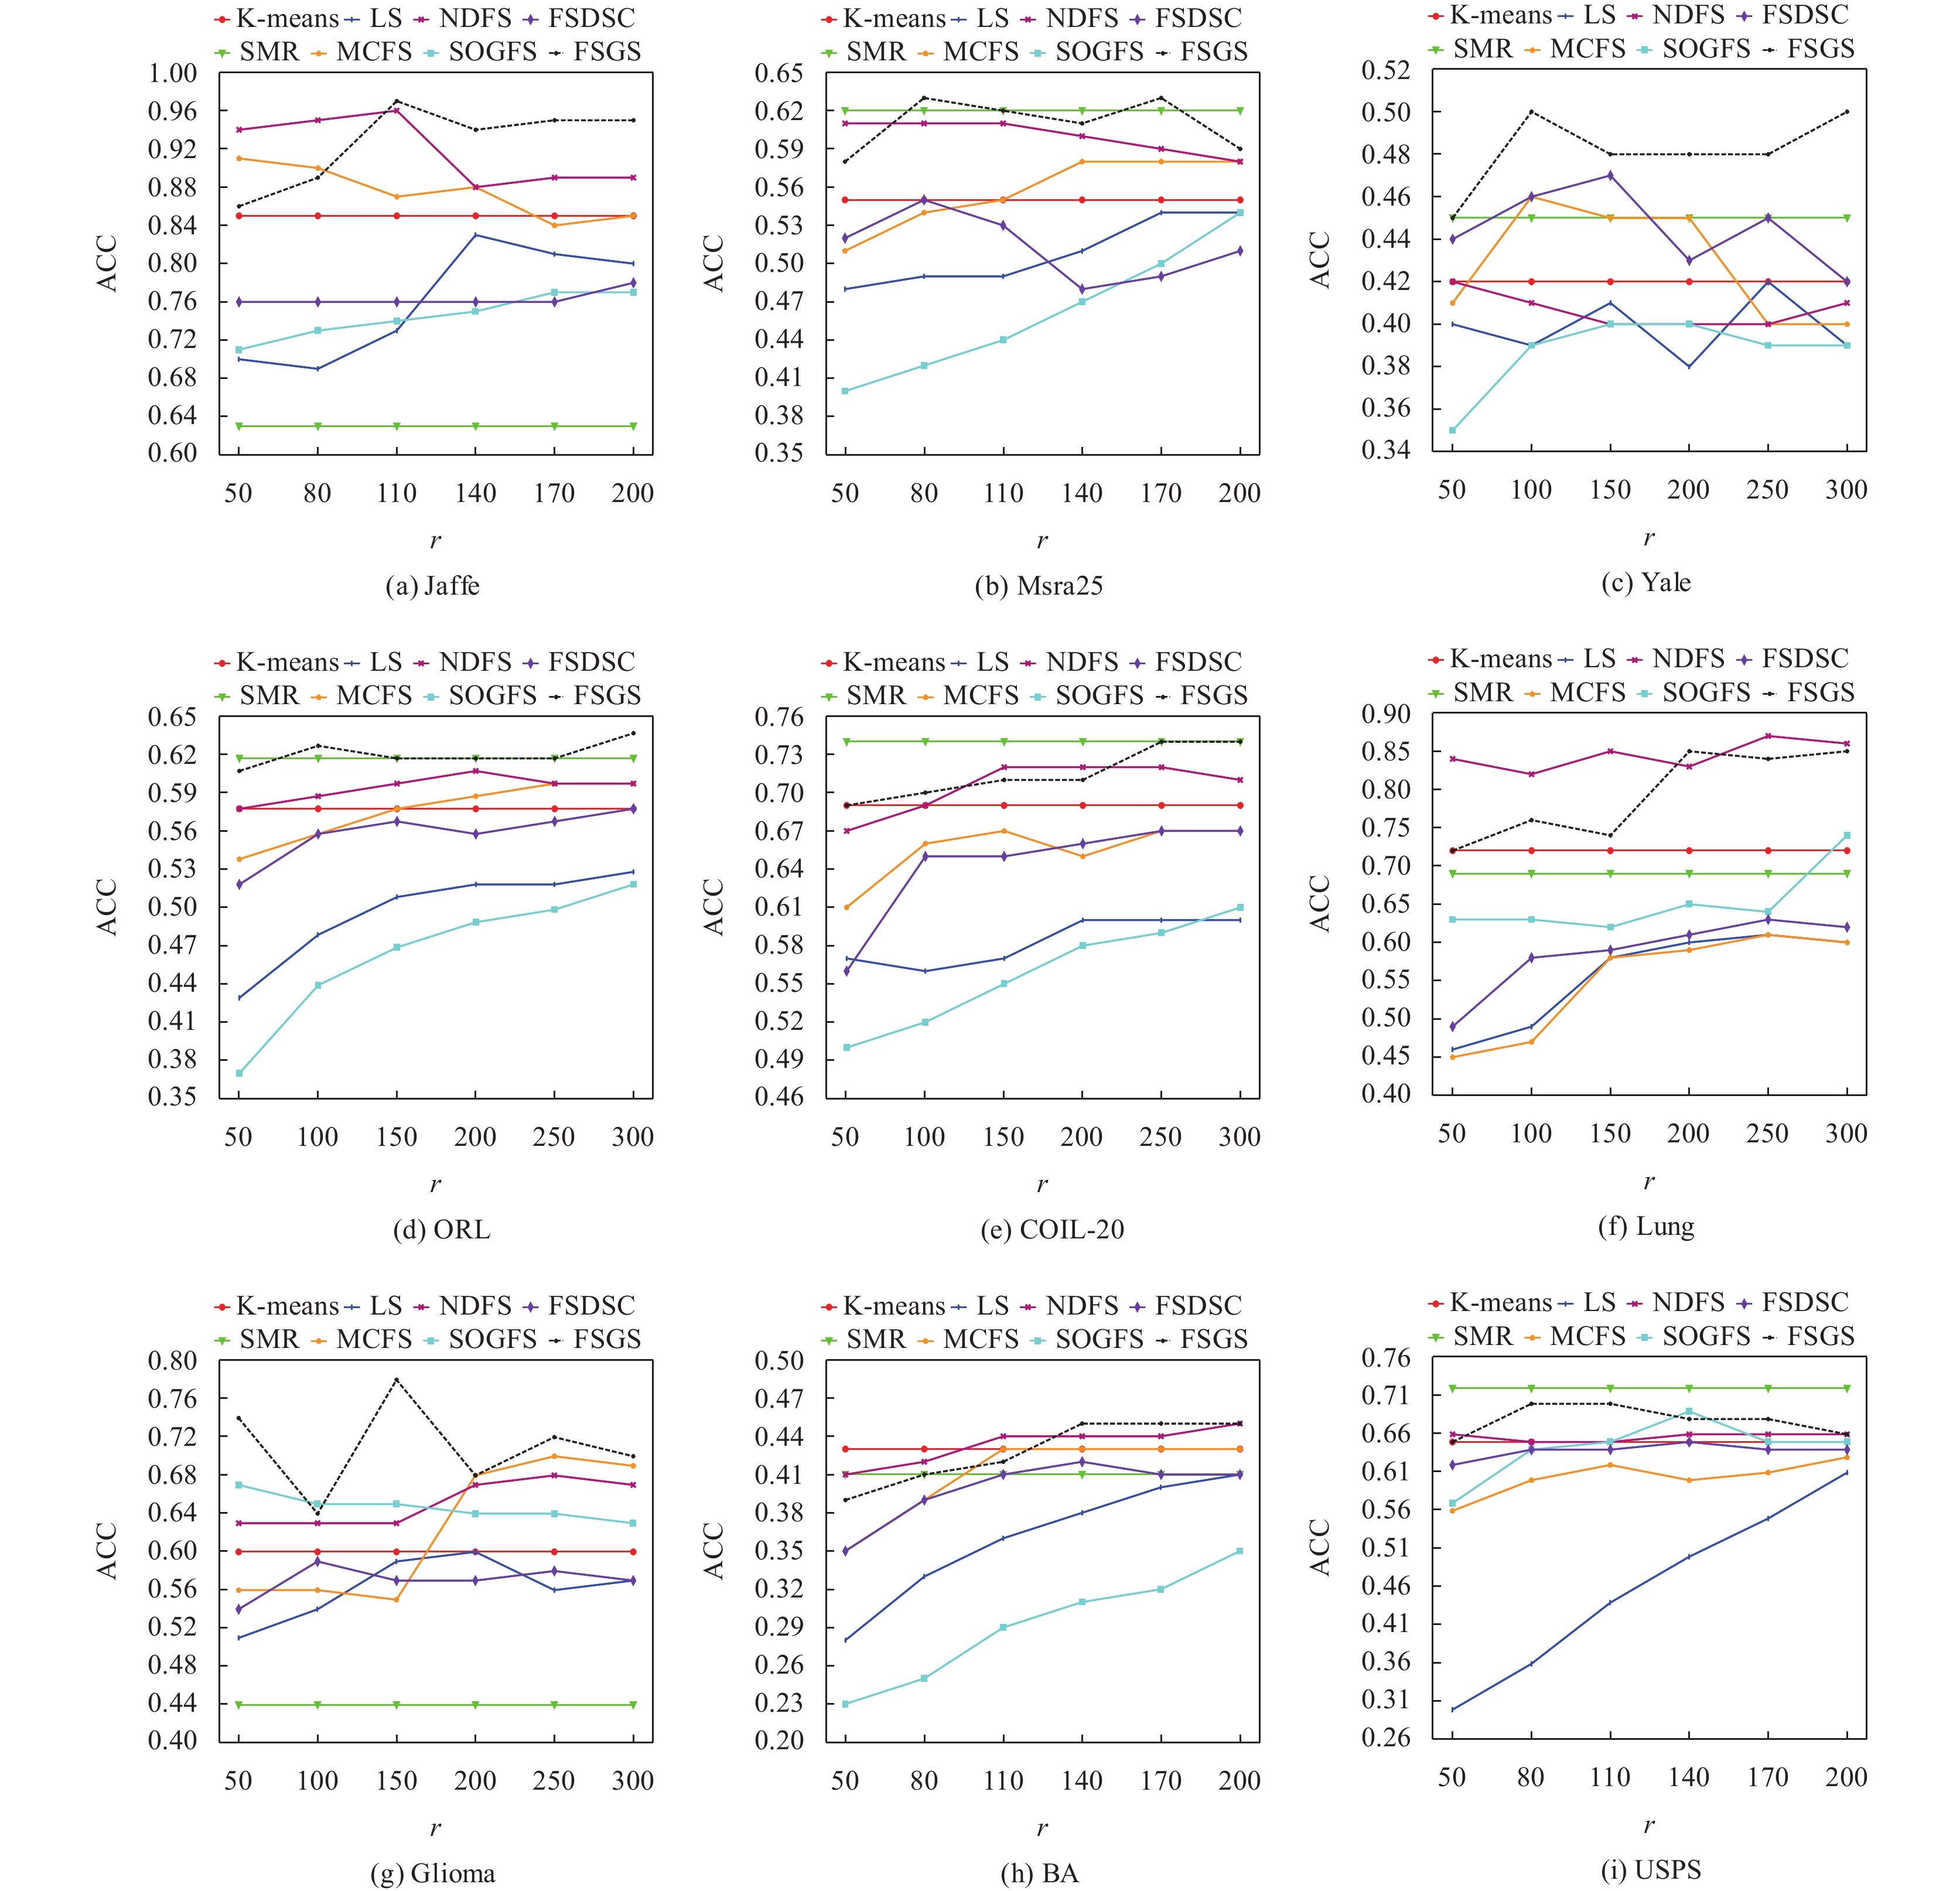
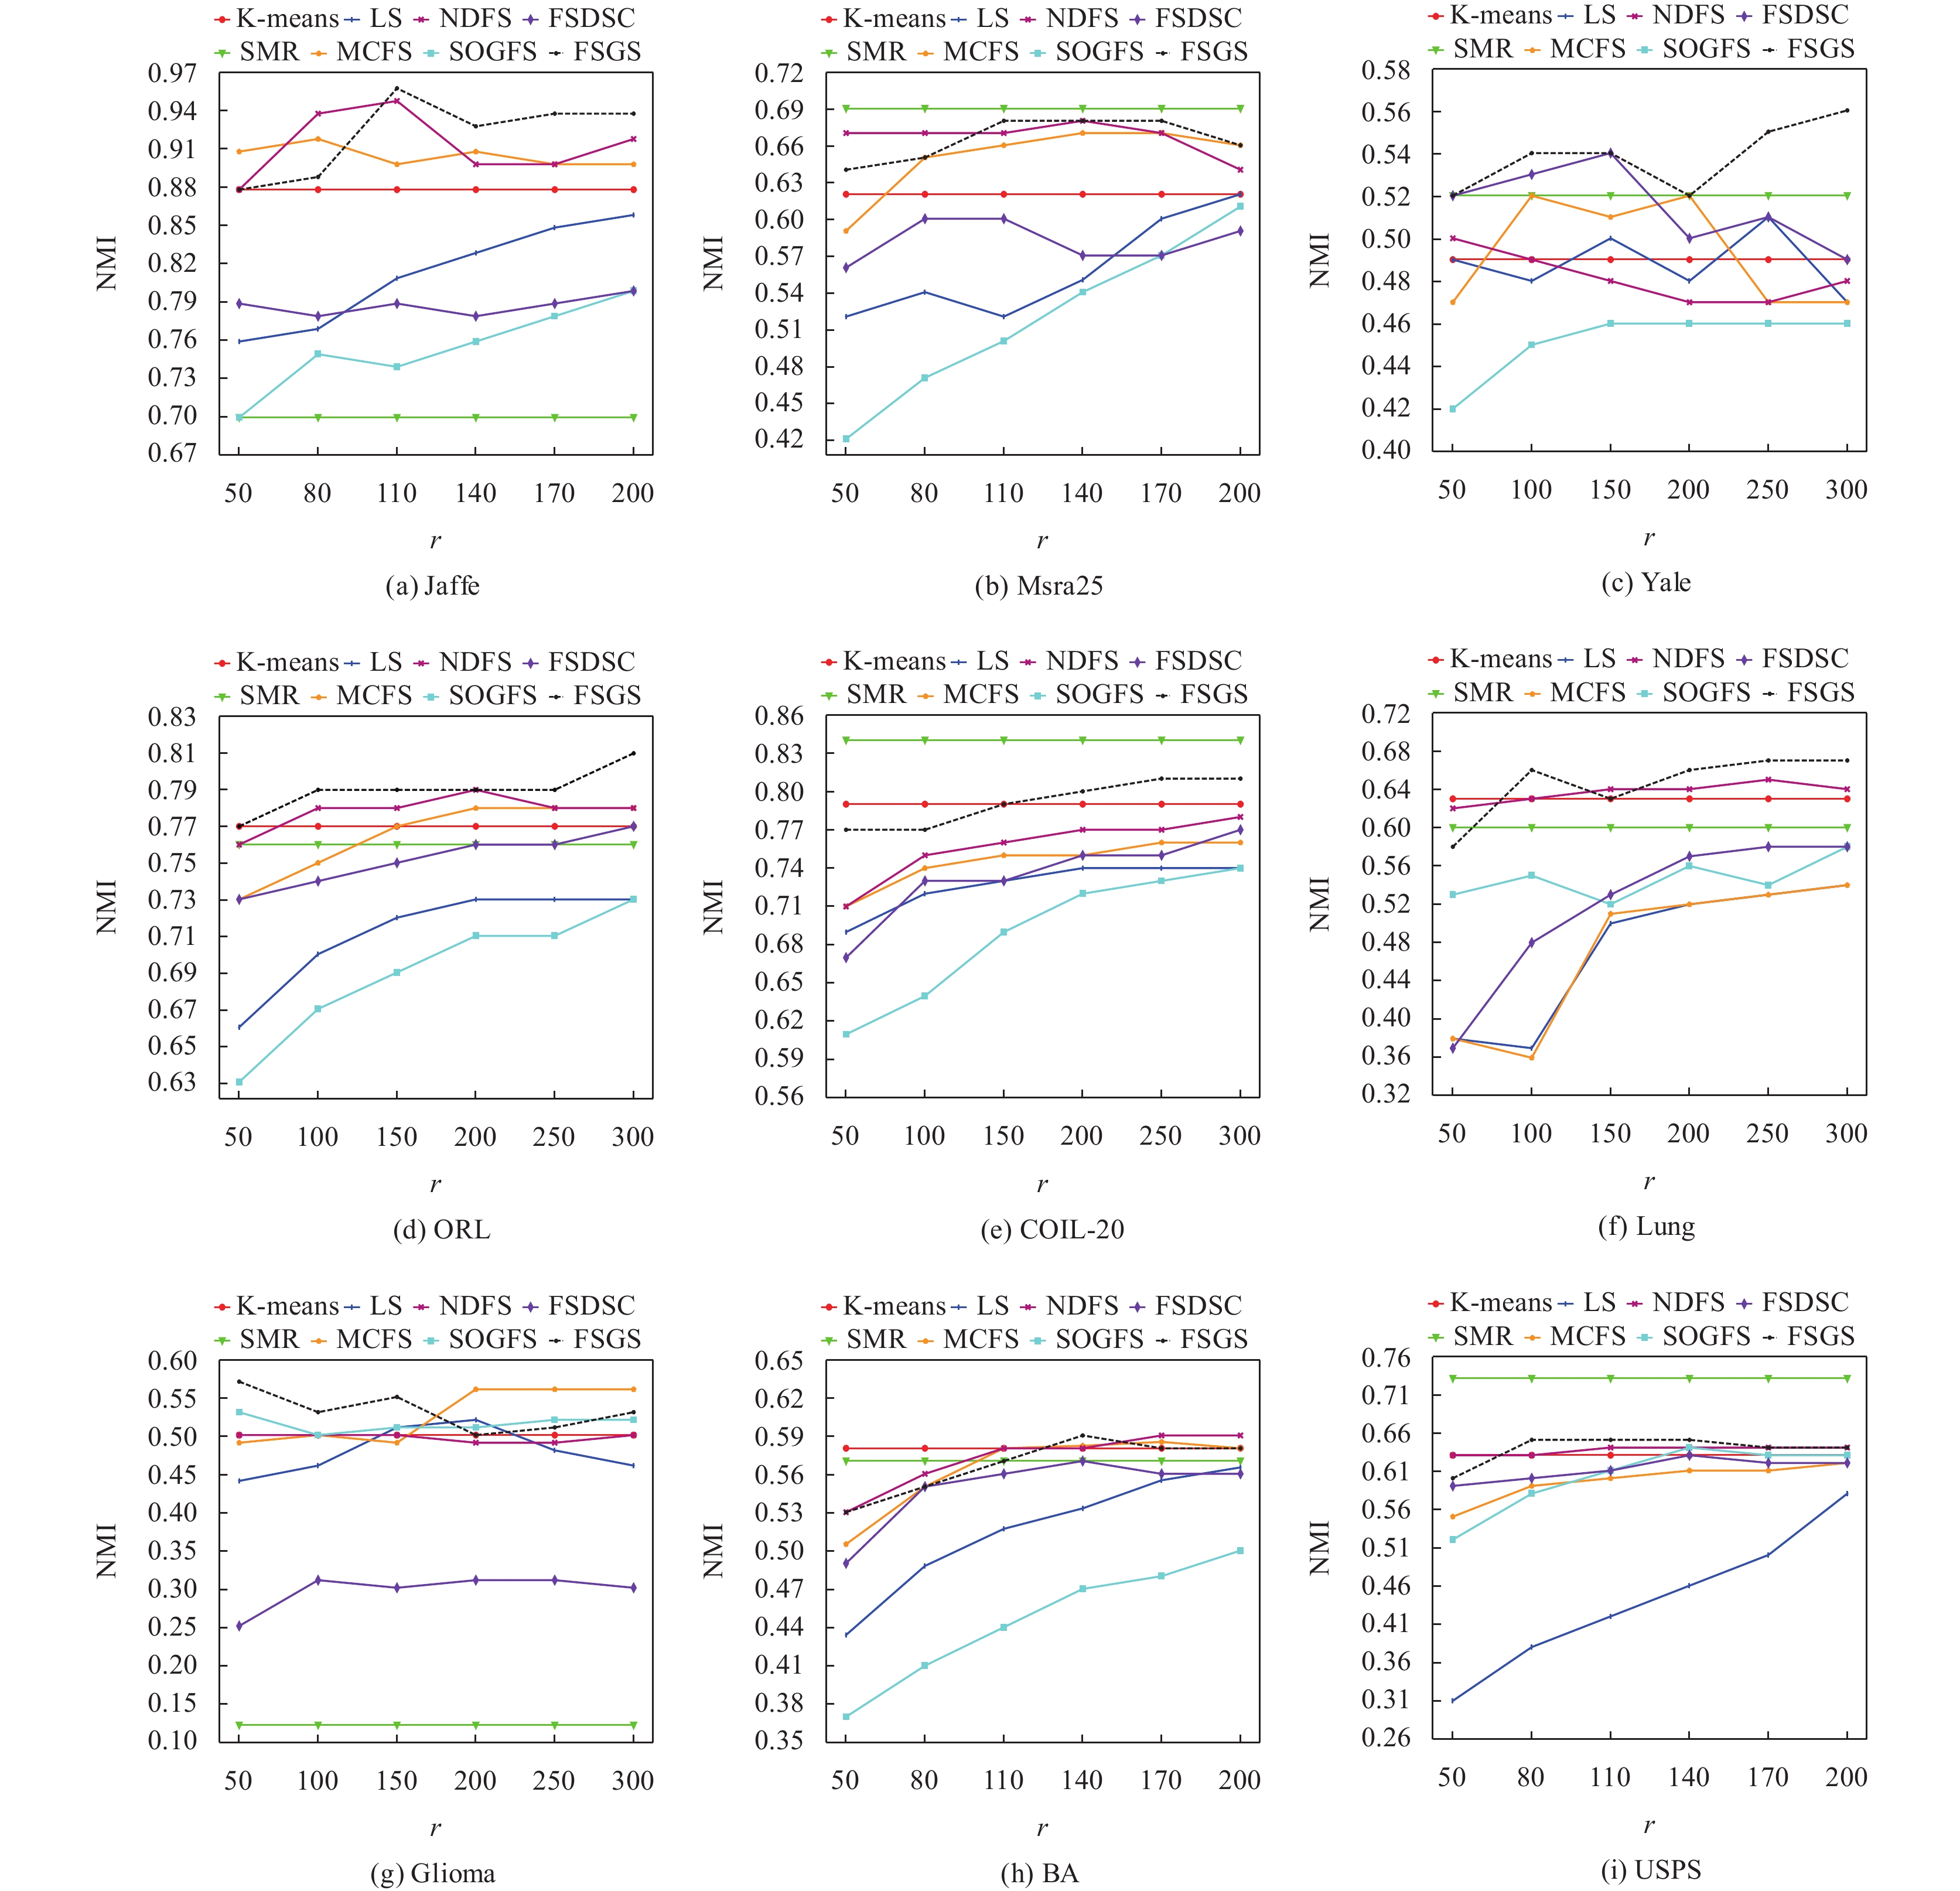
图2和图3分别为8种无监督聚类方法在9个数据集上选择特征个数与ACC和NMI的关系.
实验表明了特征选择的可行性和重要性, 大多数特征选择方法在选择少量特征的情况下可以达到甚至超过K-means方法的结果. 在大多数数据集的ACC和NMI结果中, 本文方法都超过了其他方法的结果.

|
图 2 各方法在9个数据集上选择不同特征数时的ACC结果 |

|
图 2 各方法在9个数据集上选择不同特征数时的ACC结果(续) |

|
图 3 各方法在9个数据集上选择不同特征数时的NMI结果 |

|
图 3 各方法在9个数据集上选择不同特征数时的NMI结果(续) |
通过图2和图3可以发现诸如FSGS、UDFS、SOGFS和FSDSC等嵌入式方法的性能要明显优于LS和MCFS等过滤式方法, 这表明嵌入式方法的优越性能. 同时FSGS、UDFS、FSDSC和UGFS等采用的联合学习方法聚类结果要好于MCFS采用的两步走策略.
图2和图3表明具有群组效应的SMR方法在大多数数据集上可以取得较好的效果, 但其似乎受数据集影响较大. 例如, 虽然其在COIL-20和USPS数据集上得到了所有方法中的最好效果, 但其在Glioma和Jaffe数据集上却取得了最差效果. 相反, 本文方法同样考虑了群组效应, 且选择少量特征进行聚类, 但在所有数据集上都具有稳定的表现, 且结果优于或基本等于大多数算法的结果, 这表明了本文考虑群组效应的有效性.
通过图2和图3可以发现考虑聚类指示矩阵的NDFS方法和本文方法在大多数数据集中都取得了最好效果, 这说明了在特征选择方法中充分考虑聚类指示矩阵的必要性. 而NDFS方法对于聚类指示矩阵在迭代过程中全为正时将会失效, 相比之下本文方法的泛化能力更强.
图4和图5分别表示FSGS在每个数据集上选择200个特征时ACC与NMI随不同参数

|
图 4 FSGS在9个数据集上选择不同参数 |

|
图 4 FSGS在9个数据集上选择不同参数 |

|
图 5 FSGS在9个数据集上选择不同参数 |
通过图4和图5可以分析参数
表2和表3分别表示各个方法在9个数据集上最高ACC和NMI对比, 其中黑体数字表示最高值, 下划线数字表示次高值.
| 表 2 各方法在9个数据集上最高ACC值对比 (%) |
由表2可以看出, 本文方法在6个数据集上都取得了最优的聚类结果. 在人脸数据集Jaffe、Yale和ORL上, FSGS在聚类准确度上相比于次优结果平均提升4.67%; 在高维数据集Lung和Glioma上FSGS的聚类结果位于首位或次位; 在多类别数据集ORL和BA上FSGS则取得最高的聚类结果. 这表明了FSGS考虑群组效应的鲁棒性.
| 表 3 各方法在9个数据集上最高NMI值对比 (%) |
表4表示各个方法在9个数据集上的平均运行时间对比.
| 表 4 各方法在9个数据集上的平均运行时间对比 (s) |
由表4中数据可以看出, 相比于SMR、LS和MCFS等非迭代方法, 其他采用迭代策略的方法运行时间明显上升. 在面临高维数据集Lung和Glioma时, 运行时间达到了最高, 这表明在高维数据集中选择最优组合是具有挑战性的. 其中, 采用的特征值分解法的SOGFS在面临高维数据时会造成极大的时间消耗. 本文方法的运行时间基本与NDFS方法一致且在可以接受的范围内, 并且本文方法也取得了较好的聚类效果.
综上所述, 本文方法可在不同类型的多个数据集上取得较好的效果, 泛化能力强, 运行效率高. 结果表明, 本文方法在人脸识别、生物医学等领域具有一定的应用价值, 而且相较于其他方法, 本文方法在生物医学等高维数据集上具有最短的运行时间, 因此本文方法是合理有效的无监督特征选择方法.
4 结束语本文提出基于
| [1] |
Xu YS, Chen S, Li J, et al. Fast subspace clustering by learning projective block diagonal representation. Pattern Recognition, 2023, 135: 109152. DOI:10.1016/j.patcog.2022.109152 |
| [2] |
Beiranvand F, Mehrdad V, Dowlatshahi MB. Unsupervised feature selection for image classification: A bipartite matching-based principal component analysis approach. Knowledge-based Systems, 2022, 250: 109085. DOI:10.1016/j.knosys.2022.109085 |
| [3] |
Akhtar Z, Lee JW, Attique Khan M, et al. Optical character recognition (OCR) using partial least square (PLS) based feature reduction: An application to artificial intelligence for biometric identification. Journal of Enterprise Information Management, 2023, 36(3): 767-789. DOI:10.1108/JEIM-02-2020-0076 |
| [4] |
Bojaraj L, Jaikumar R. Hierarchical clustering fuzzy features subset classifier with ant colony optimization for lung image classification. In: Singhal P, Verma A, Srivastava PK, et al. eds. Image Processing and Intelligent Computing Systems. Boca Raton: CRC Press, 2023. 49–62.
|
| [5] |
Li D, Liang HN, Qin P, et al. A self-training subspace clustering algorithm based on adaptive confidence for gene expression data. Frontiers in Genetics, 2023, 14: 1132370. DOI:10.3389/fgene.2023.1132370 |
| [6] |
Mousavian Anaraki SA, Haeri A, Moslehi F. A hybrid reciprocal model of PCA and K-means with an innovative approach of considering sub-datasets for the improvement of K-means initialization and step-by-step labeling to create clusters with high interpretability. Pattern Analysis and Applications, 2021, 24(3): 1387-1402. DOI:10.1007/s10044-021-00977-x |
| [7] |
Zhu PC, Hou X, Tang KK, et al. Unsupervised feature selection through combining graph learning and ℓ2,0-norm constraint. Information Sciences, 2023, 622: 68-82. DOI:10.1016/j.ins.2022.11.156 |
| [8] |
Turk MA, Pentland AP. Face recognition using eigenfaces. Proceedings of the 1991 IEEE Computer Society Conference on Computer Vision and Pattern Recognition. Maui: IEEE, 1991. 586–591.
|
| [9] |
Luo C, Zheng J, Li TR, et al. Orthogonally constrained matrix factorization for robust unsupervised feature selection with local preserving. Information Sciences, 2022, 586: 662-675. DOI:10.1016/j.ins.2021.11.068 |
| [10] |
Guyon I, Elisseeff A. An introduction to variable and feature selection. Journal of Machine Learning Research, 2003, 3: 1157-1182. |
| [11] |
Zhou Y, Zhang WJ, Kang JH, et al. A problem-specific non-dominated sorting genetic algorithm for supervised feature selection. Information Sciences, 2021, 547: 841-859. DOI:10.1016/j.ins.2020.08.083 |
| [12] |
Chen XJ, Chen RJ, Wu QY, et al. Semisupervised feature selection via structured manifold learning. IEEE Transactions on Cybernetics, 2022, 52(7): 5756-5766. DOI:10.1109/TCYB.2021.3052847 |
| [13] |
Cai D, Zhang CY, He XF. Unsupervised feature selection for multi-cluster data. Proceedings of the 16th ACM SIGKDD International Conference on Knowledge Discovery and Data Mining. Washington: ACM, 2010. 333–342.
|
| [14] |
Li ZC, Yang Y, Liu J, et al. Unsupervised feature selection using nonnegative spectral analysis. Proceedings of the 26th AAAI Conference on Artificial Intelligence. Toronto: AAAI, 2012. 1026–1032.
|
| [15] |
Wang R, Zhang CY, Bian JT, et al. Sparse and flexible projections for unsupervised feature selection. IEEE Transactions on Knowledge and Data Engineering, 2023, 35(6): 6362-6375. |
| [16] |
He XF, Cai D, Niyogi P. Laplacian score for feature selection. Proceedings of the 18th International Conference on Neural Information Processing Systems. Vancouver: MIT Press, 2005. 507–514.
|
| [17] |
Bommert A, Welchowski T, Schmid M, et al. Benchmark of filter methods for feature selection in high-dimensional gene expression survival data. Briefings in Bioinformatics, 2022, 23(1): bbab354. DOI:10.1093/bib/bbab354 |
| [18] |
孙雅芝, 江峰, 杨志勇. 基于粒度粗糙熵与改进蜂群算法的特征选择. 计算机系统应用, 2023, 32(6): 121-129. DOI:10.15888/j.cnki.csa.009108 |
| [19] |
Fang XZ, Xu Y, Li XL, et al. Locality and similarity preserving embedding for feature selection. Neurocomputing, 2014, 128: 304-315. DOI:10.1016/j.neucom.2013.08.040 |
| [20] |
Zhang R, Zhang YX, Li XL. Unsupervised feature selection via adaptive graph learning and constraint. IEEE Transactions on Neural Networks and Learning Systems, 2022, 33(3): 1355-1362. DOI:10.1109/TNNLS.2020.3042330 |
| [21] |
Luo MN, Nie FP, Chang XJ, et al. Adaptive unsupervised feature selection with structure regularization. IEEE Transactions on Neural Networks and Learning Systems, 2018, 29(4): 944-956. DOI:10.1109/TNNLS.2017.2650978 |
| [22] |
Zhang H, Zhang R, Nie FP, et al. An efficient framework for unsupervised feature selection. Neurocomputing, 2019, 366: 194-207. DOI:10.1016/j.neucom.2019.07.020 |
| [23] |
Lu CY, Min H, Zhao ZQ, et al. Robust and efficient subspace segmentation via least squares regression. Proceedings of the 12th European Conference on Computer Vision. Florence: Springer, 2012. 347–360.
|
| [24] |
Hu H, Lin ZC, Feng JJ, et al. Smooth representation clustering. Proceedings of the 2014 IEEE Conference on Computer Vision and Pattern Recognition. Columbus: IEEE, 2014. 3834–3841.
|
| [25] |
Wang P, Han B, Li J, et al. Structural reweight sparse subspace clustering. Neural Processing Letters, 2019, 49(3): 965-977. DOI:10.1007/s11063-018-9859-8 |
| [26] |
Nie FP, Zhu W, Li XL. Structured graph optimization for unsupervised feature selection. IEEE Transactions on Knowledge and Data Engineering, 2019, 33(3): 1210-1222. |
| [27] |
Du XZ, Nie FP, Wang WQ, et al. Exploiting combination effect for unsupervised feature selection by ℓ2,0 norm. IEEE Transactions on Neural Networks and Learning Systems, 2019, 30(1): 201-214. DOI:10.1109/TNNLS.2018.2837100 |
| [28] |
Shang RH, Kong JR, Wang LJ, et al. Unsupervised feature selection via discrete spectral clustering and feature weights. Neurocomputing, 2023, 517: 106-117. DOI:10.1016/j.neucom.2022.10.053 |
| [29] |
Yang ZG, Wang JK, Li Q, et al. Graph optimization for unsupervised dimensionality reduction with probabilistic neighbors. Applied Intelligence, 2023, 53(2): 2348-2361. DOI:10.1007/s10489-022-03534-z |
| [30] |
Nie FP, Wang XQ, Huang H. Clustering and projected clustering with adaptive neighbors. Proceedings of the 20th ACM SIGKDD International Conference on Knowledge Discovery and Data Mining. New York: ACM, 2014. 977–986.
|
| [31] |
Belkin M, Niyogi P. Laplacian eigenmaps and spectral techniques for embedding and clustering. Proceedings of the 14th International Conference on Neural Information Processing Systems: Natural and Synthetic. Vancouver: MIT Press, 2001. 585–591.
|
| [32] |
Zhu PF, Zhu WC, Hu QH, et al. Subspace clustering guided unsupervised feature selection. Pattern Recognition, 2017, 66: 364-374. DOI:10.1016/j.patcog.2017.01.016 |
| [33] |
Nie FP, Zhang R, Li XL. A generalized power iteration method for solving quadratic problem on the stiefel manifold. Science China Information Sciences, 2017, 60(11): 112101. DOI:10.1007/s11432-016-9021-9 |
| [34] |
Lyons MJ, Budynek J, Akamatsu S. Automatic classification of single facial images. IEEE Transactions on Pattern Analysis and Machine Intelligence, 1999, 21(12): 1357-1362. DOI:10.1109/34.817413 |
| [35] |
He XF, Yan SC, Hu YX, et al. Learning a locality preserving subspace for visual recognition. Proceedings of the 9th IEEE International Conference on Computer Vision. Nice: IEEE, 2003. 385–392.
|
| [36] |
Nene SA, Nayar SK, Murase H. Columbia object image library (COIL-20). Technical Report, CUCS-006-96, New York: Columbia University, 1996.
|
| [37] |
Singh D, Febbo PG, Ross K, et al. Gene expression correlates of clinical prostate cancer behavior. Cancer Cell, 2002, 1(2): 203-209. DOI:10.1016/S1535-6108(02)00030-2 |
| [38] |
Li JD, Cheng KW, Wang SH, et al. Feature selection: A data perspective. ACM Computing Surveys, 2017, 50(6): 94. |
| [39] |
Belhumeur PN, Hespanha JP, Kriegman DJ. Eigenfaces vs. fisherfaces: Recognition using class specific linear projection. IEEE Transactions on Pattern Analysis and Machine Intelligence, 1997, 19(7): 711–720.
|
| [40] |
Hull JJ. A database for handwritten text recognition research. IEEE Transactions on Pattern Analysis and Machine Intelligence, 1994, 16(5): 550-554. DOI:10.1109/34.291440 |
| [41] |
Kuhn HW. The Hungarian method for the assignment problem. Naval Research Logistics Quarterly, 1955, 2(1–2): 83-97. DOI:10.1002/nav.3800020109 |
 2024, Vol. 33


